· 4 min read
Monitor Your Endpoints and Know When Something Breaks
Checking whether a URL returns 200 is the easy part. Not being woken by a blip, and having somewhere to point people when it is real, is the rest of it.
Any monitoring tool can tell you a URL returned 500. The parts that decide whether monitoring is useful or just noisy are the ones either side of that: what you point it at, whether it pages you for a single dropped packet, and where your users go when they want to know if it is you or them.
Point it at something that means something
The most common mistake is monitoring the front page. A static marketing page served from a cache will happily return 200 for hours after your database has fallen over, and you will find out about the outage from a customer.
Monitor a path that exercises the thing you actually care about. A small health endpoint that touches the database and returns quickly is worth more than any number of checks against pages that cannot fail:
GET /api/health -> 200, touches the DB, returns { ok: true }
Then add the one or two endpoints that carry your revenue — the login POST, the checkout callback, the API route your customers' integrations depend on. Three well-chosen checks beat twenty pointed at pages that are always up. The free plan covers one monitor, which is a useful constraint: it forces you to decide which single request best answers "is the product working". Pro allows ten.
A health endpoint that reports version numbers, queue depths or connection strings is a health endpoint you have to think about. Return the minimum: a status code, and enough of a body to prove the request went through the stack rather than stopping at your reverse proxy.
Set the interval you will actually act on
An interval is a promise about how fast you want to know. On the free plan checks run every five minutes; Pro goes down to one. Faster is not automatically better — a one-minute interval on a service you cannot fix before morning buys you nothing except more chances to be woken up.
The other two settings matter more than people expect:
- Timeout — the point at which slow counts as down. Ten seconds is a sane default, but if your endpoint normally answers in 80ms, a ten-second timeout means a badly degraded service still reads as healthy.
- Expected status — usually 200, but not always. An endpoint that correctly returns 401 without credentials should be checked for 401. A monitor that expects the wrong number is a monitor you will learn to ignore.
Do not get paged for a blip
This is the difference between monitoring you trust and monitoring you mute.
Networks drop packets. A single failed check is not an outage — it is a fact about one request. If every one of them sends an email, you will have filtered those emails into a folder within a fortnight, and the folder is where the real outage will also land.
FeedFast confirms before it commits: a monitor flips to DOWN only after two
consecutive failed checks. One bad request is recorded but does not open an
incident and does not send anything. When the second confirms it, an incident
opens and the alert goes out with the cause attached — HTTP 500, Timeout,
DNS error — so you know whether to open your laptop before you open it.
Recovery is announced the same way: "recovered after 14m", which is the number you will want when you write the post-mortem.
Give people somewhere to look
During an outage your inbox and your support channel fill up with one question, asked separately by everyone. A status page answers it once.
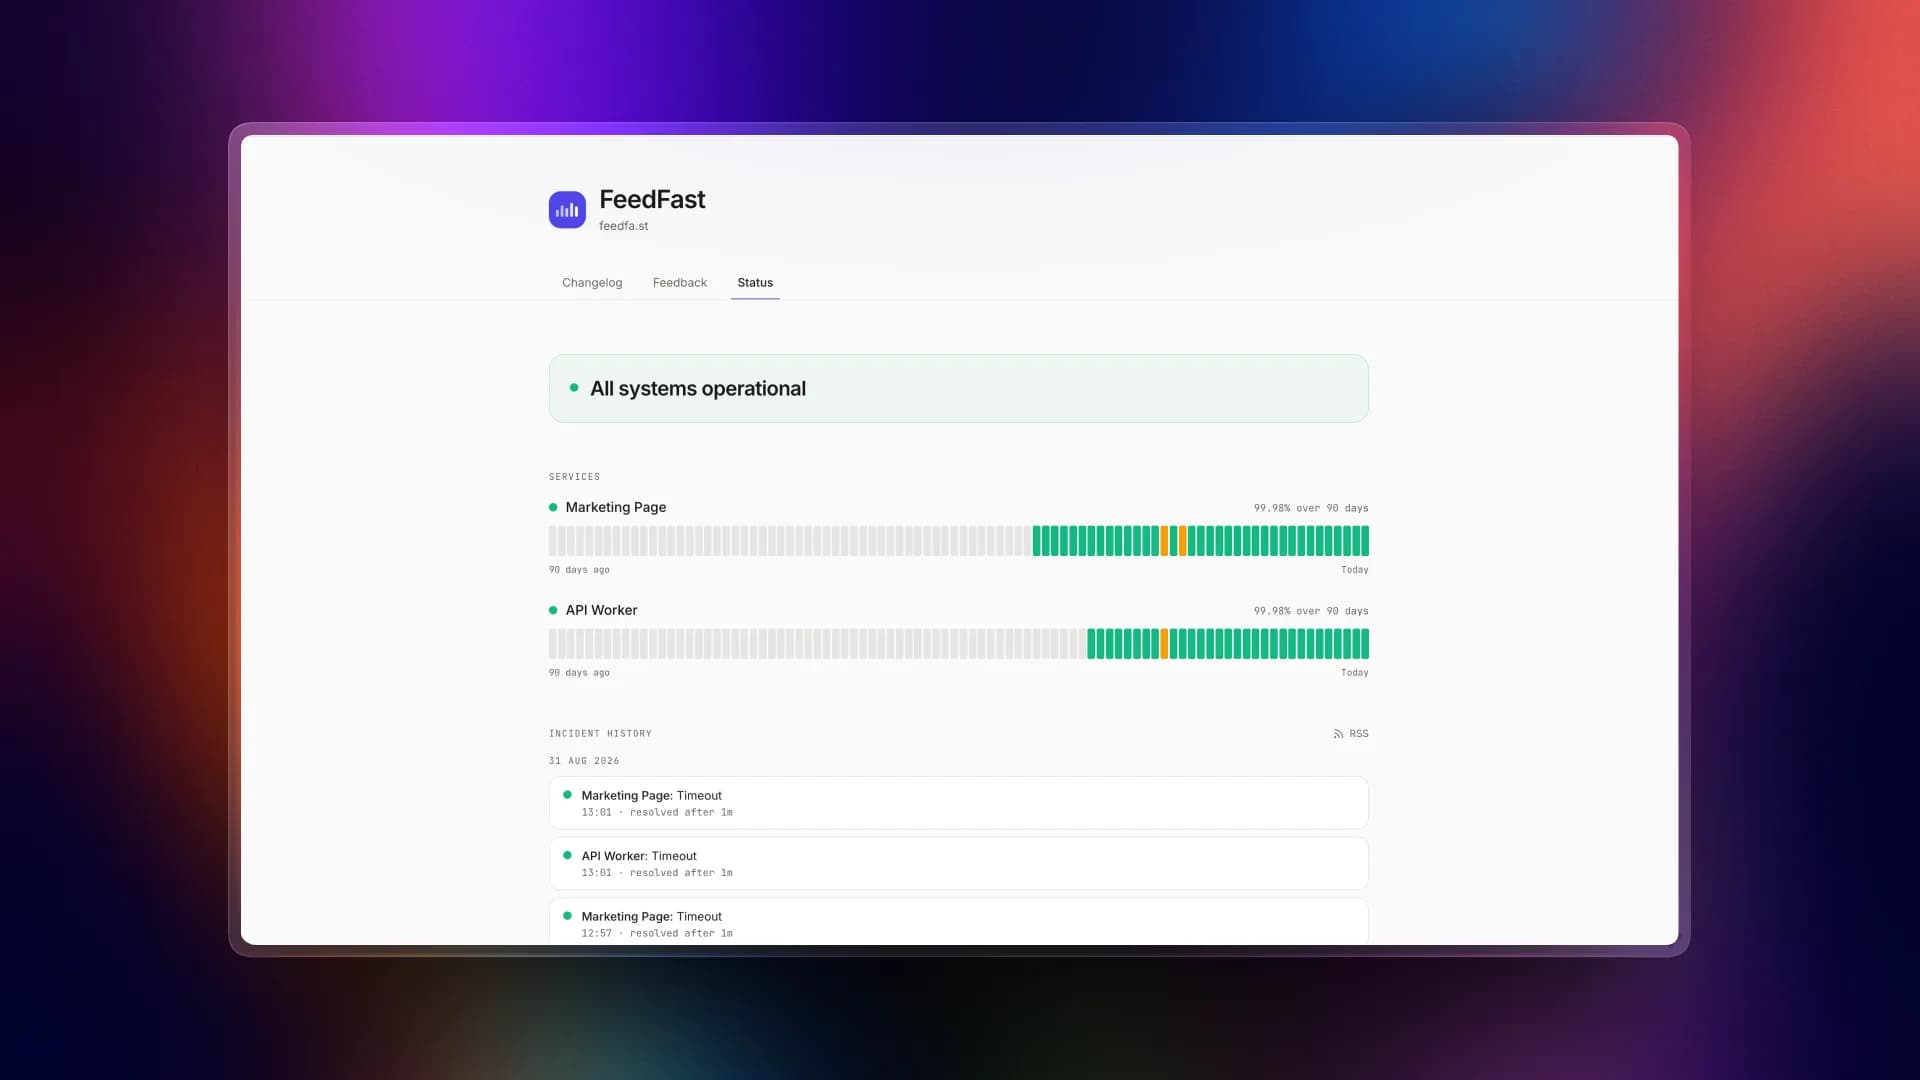
Every project gets a status page, showing each monitor with a 90-day bar strip, uptime over 24 hours, 7 days and 30 days, and the incident history underneath. Anyone can subscribe by email — double opt-in, unsubscribe link in every message — and they are then told when an incident opens and when it resolves, without you writing anything. The free plan allows 25 subscribers, Pro is unlimited.
Link it from your app's footer before you need it — this one is live. A status page discovered during an outage is a status page nobody can find.
Plan the downtime you know about
Deploys, migrations and provider maintenance all look exactly like an outage to a monitoring system. Two things follow: you get paged for work you scheduled, and your users see red on a status page for something entirely intentional.
Schedule a maintenance window instead. During one, checks on the affected monitors still run and are still recorded — but no incidents open, no alerts go out, those monitors read as "under maintenance" in blue rather than down, and the window is excluded from your uptime percentages. Subscribers get told when it is scheduled, when it starts, and when it finishes.
Which means a 2am database upgrade is announced rather than alarming, and your 30-day uptime figure stays a measure of unplanned failure — the only thing that number is good for.
What good looks like
- Two or three checks against endpoints that can genuinely fail
- Timeouts set near real latency, not ten seconds by default
- Confirmation before alerting, so every email means something
- A status page linked in your footer today
- Planned work scheduled, not explained afterwards
An honest incident history is also, quietly, a sales asset: it is checkable in a way a claim is not.
Set up like that, monitoring is a thing you forget about — which is the entire point. The measure of it is not how much it tells you. It is whether you believe it the one time it does.